
Introduction
As we enter into the year 2023, it’s becoming increasingly clear that blockchain technology has firmly established its place in the world, with both companies and individuals embracing its potential. Despite the impact of the recession and bear market on market capitalization, over 300 million people worldwide, which accounts for 3.9% of the global population, are currently utilizing blockchain or cryptocurrency. Notably, there are now over 82 million Bitcoin wallets and 425 million crypto holders worldwide. Additionally, it’s expected that companies will spend nearly $19 billion on blockchain technology by 2024, and 90% of banks in the U.S., Canada, and Europe are currently exploring blockchain technology. The aim of this report is to provide an overview of the key metrics of blockchains, NFT and DeFi platforms as of May 2023, while also considering the economic downturn, and offering insights into the future of this rapidly evolving ecosystem.
Executive Summary
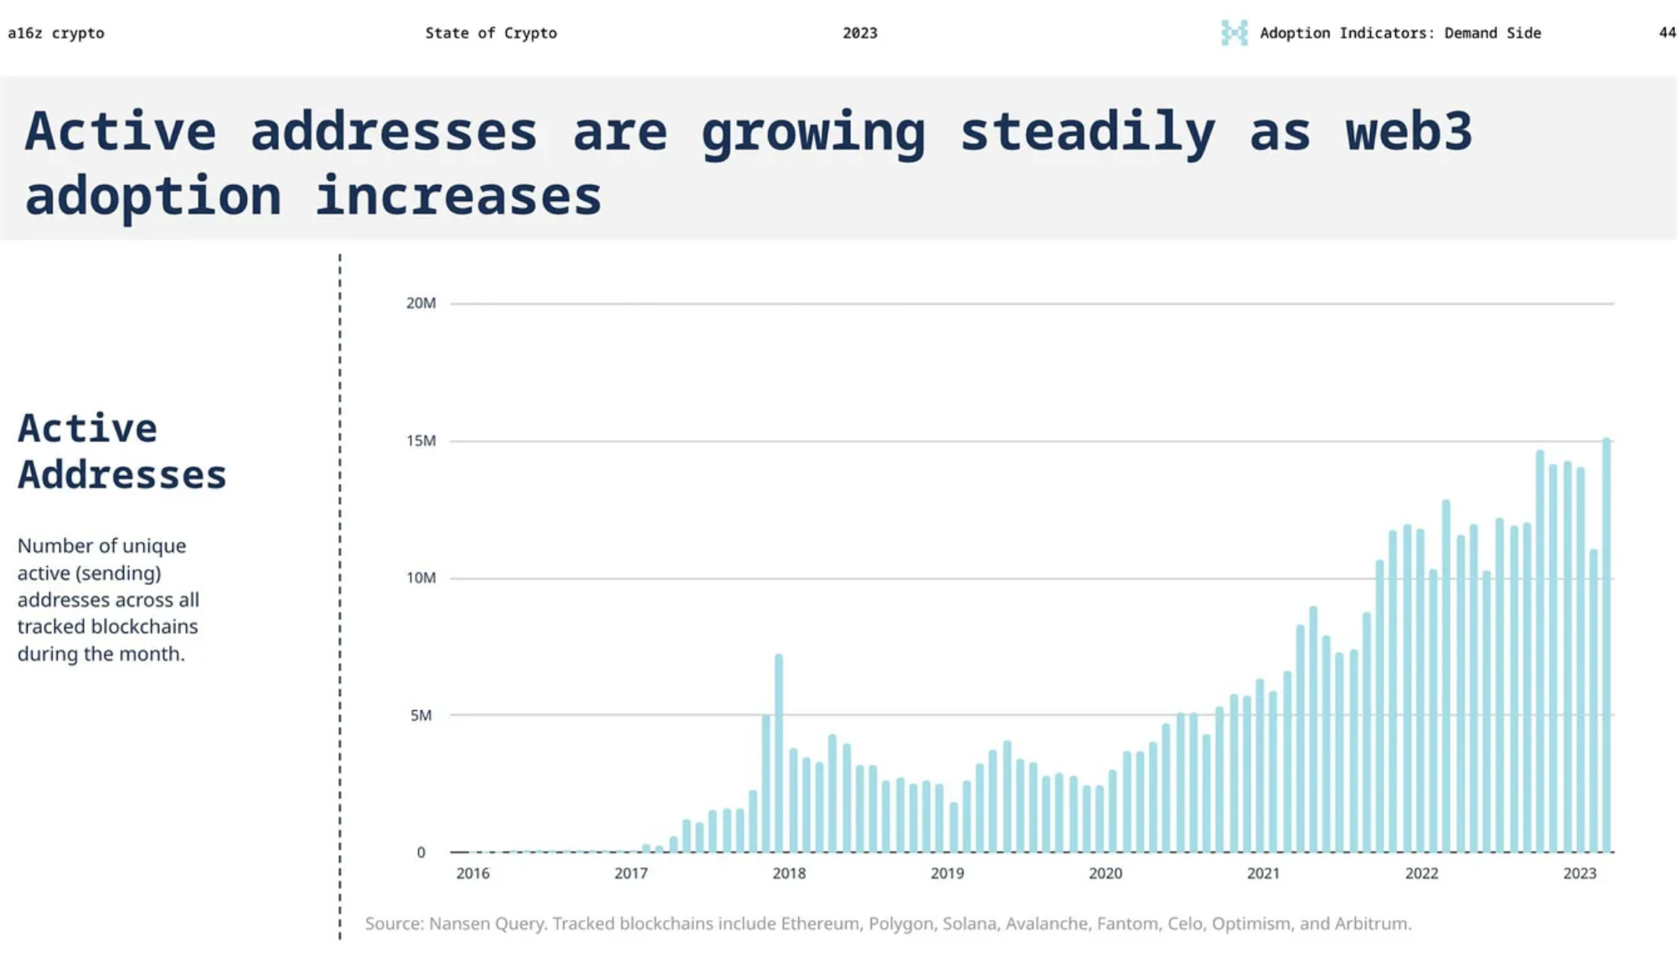
- The number of sending addresses has surged to 15 million, which is more than twice the amount recorded two years ago.
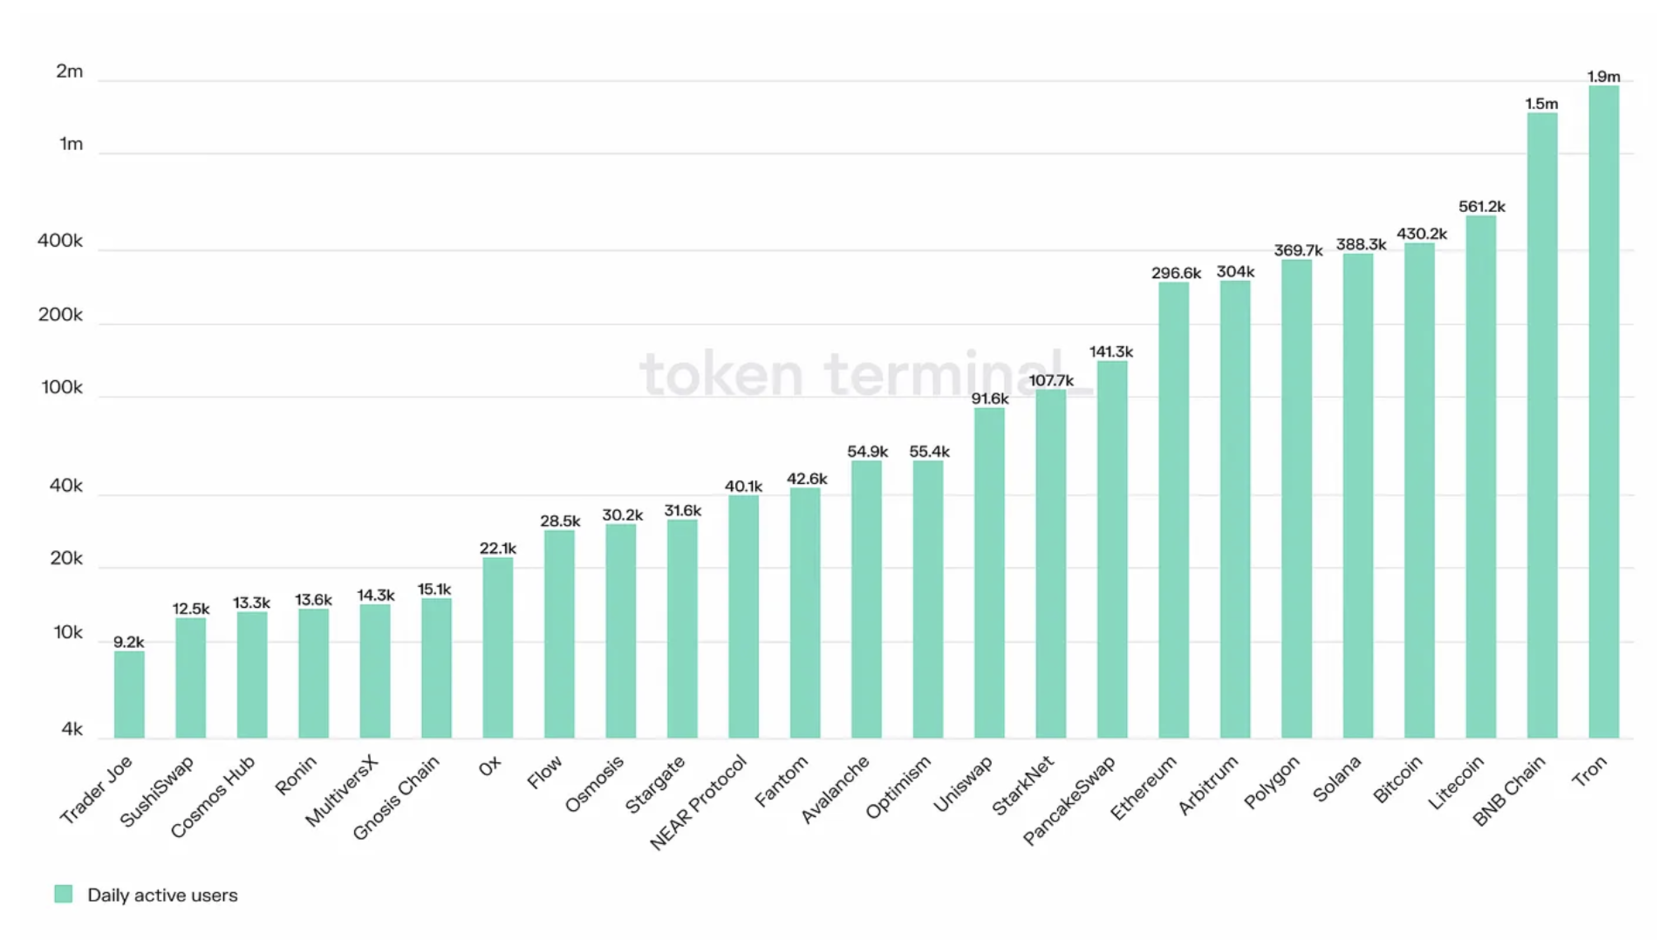
- The most active blockchains in terms of daily active users (DAU) are Tron, Binance Smart Chain, Litecoin, and Ethereum.
- The total count of blockchain transactions has increased by more than 50% in the last two years.
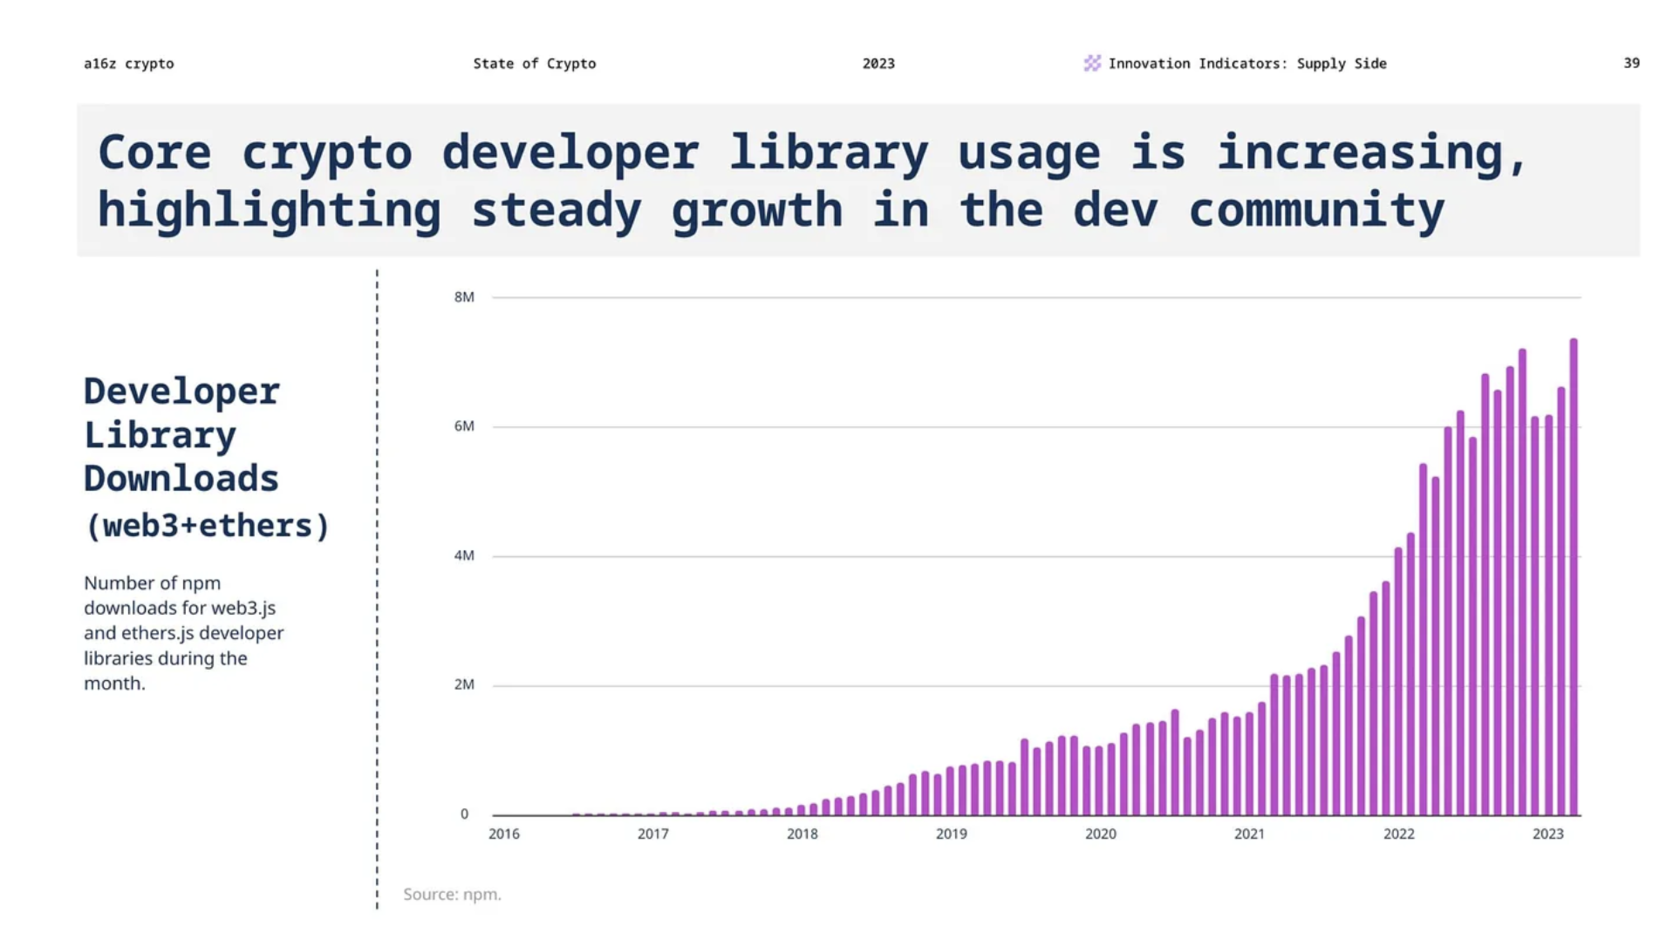
- There are almost 30,000 developers actively participating in the crypto industry each month.
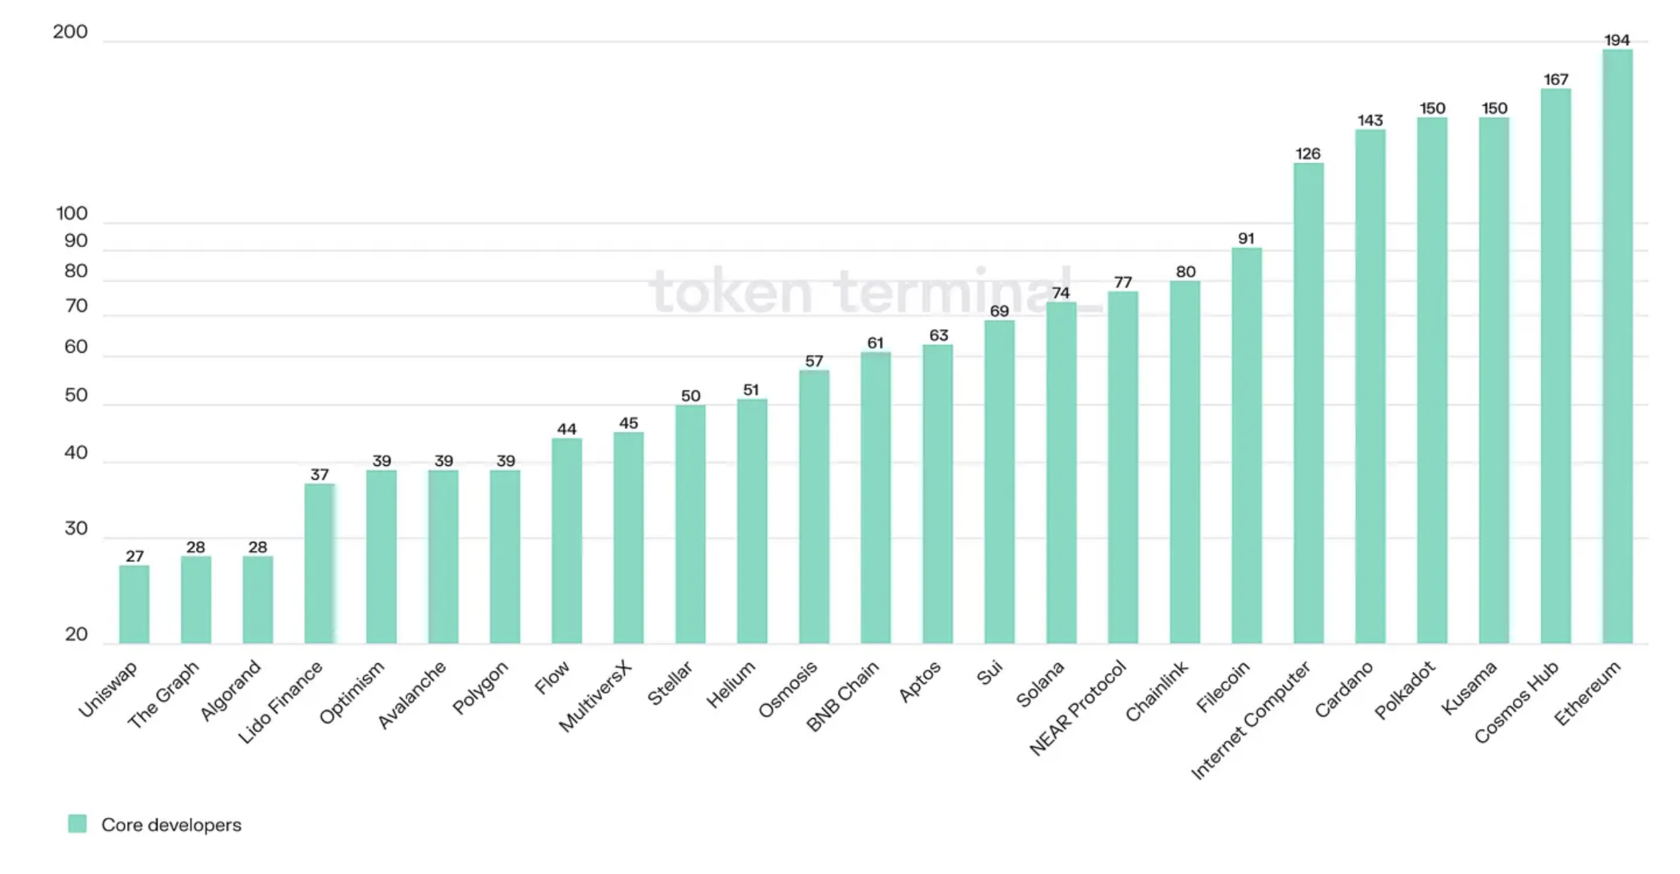
- The most active blockchains in terms of core developers (CD) are Ethereum, Cosmos, Kusama, Polkadot, and Cardano.
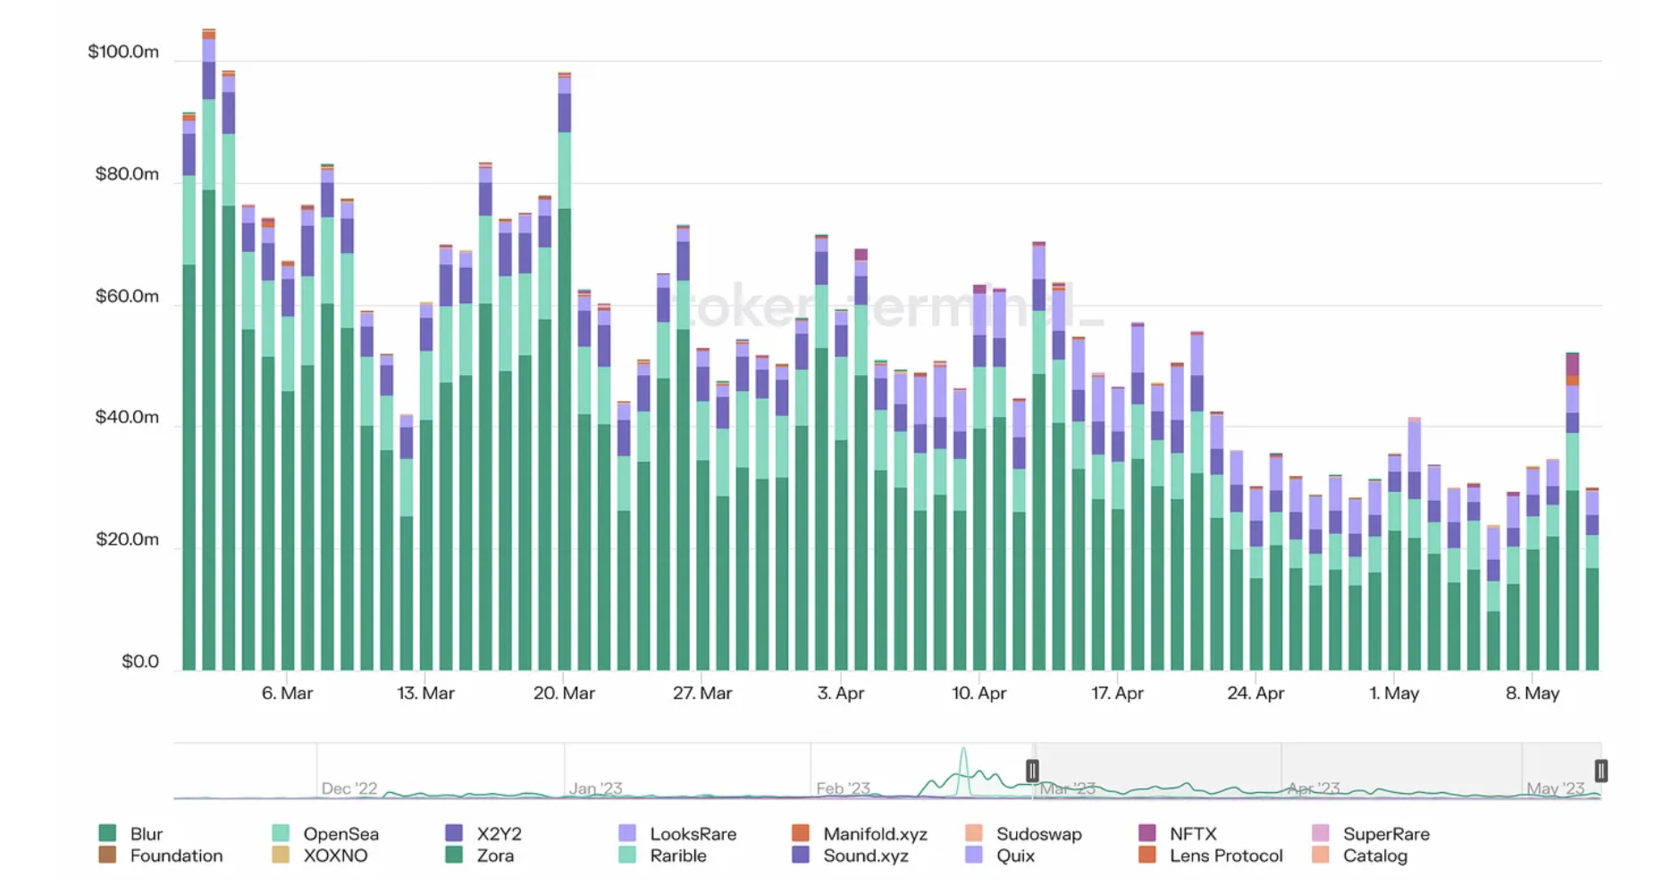
- The total trading volume on NFT platforms has decreased from $90MM on the 1st of March to $30MM as of the 12th of May.
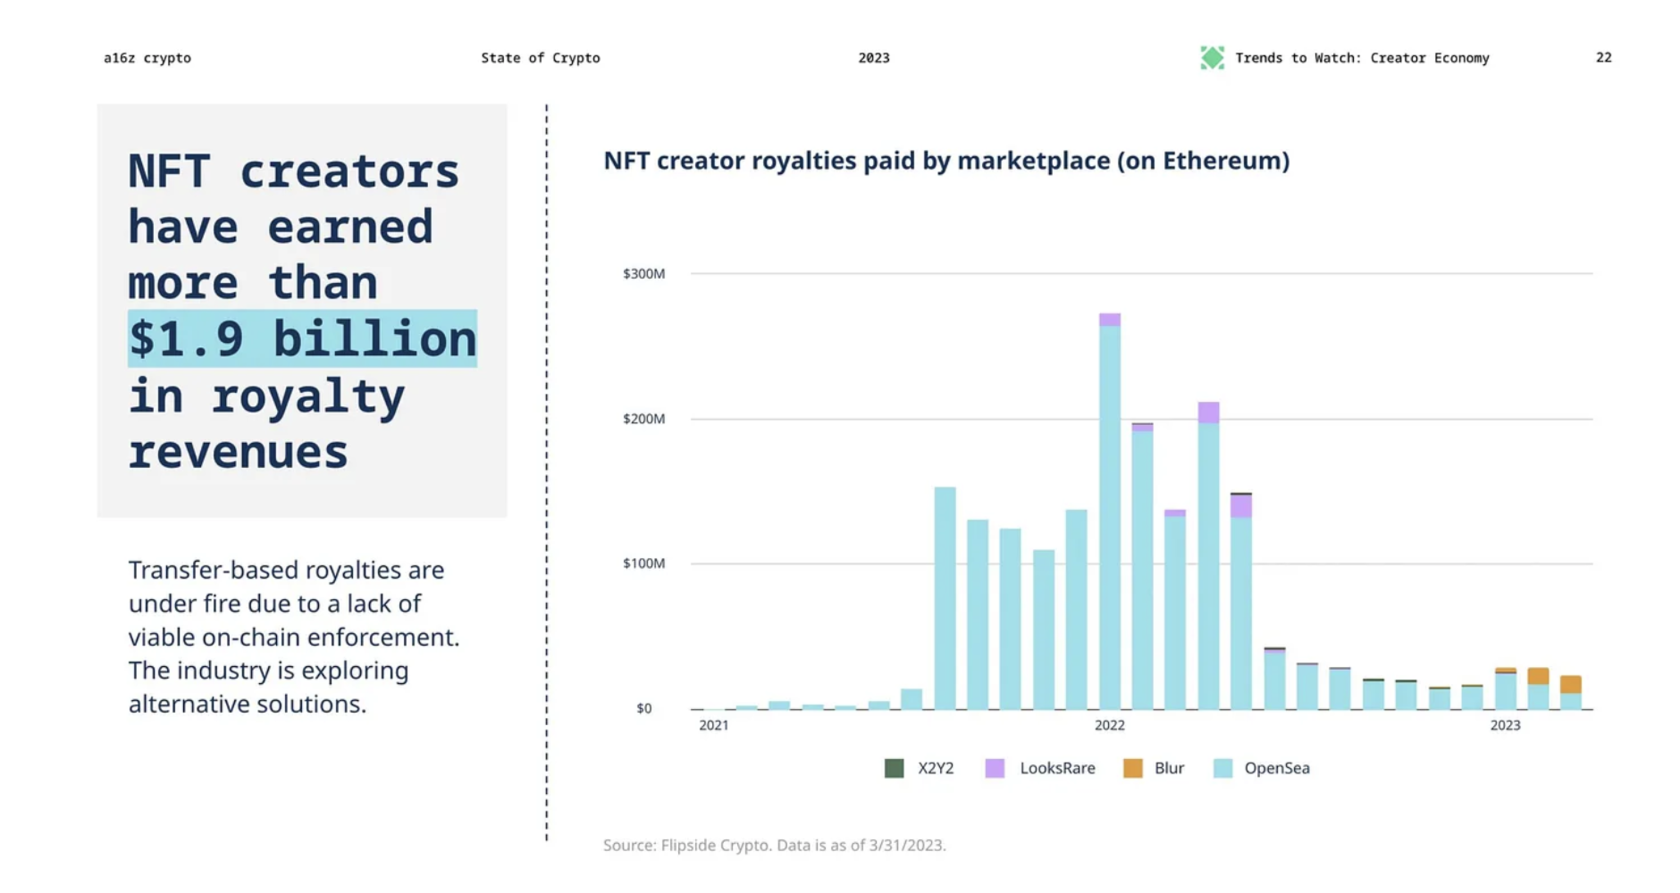
- Over the past couple of years, NFT platforms have distributed royalties worth almost $2 billion in secondary sales to creators.
- Uniswap, a decentralized exchange, has recorded greater trading volume than Coinbase, the largest centralized exchange in the U.S, for the last two months in a row.
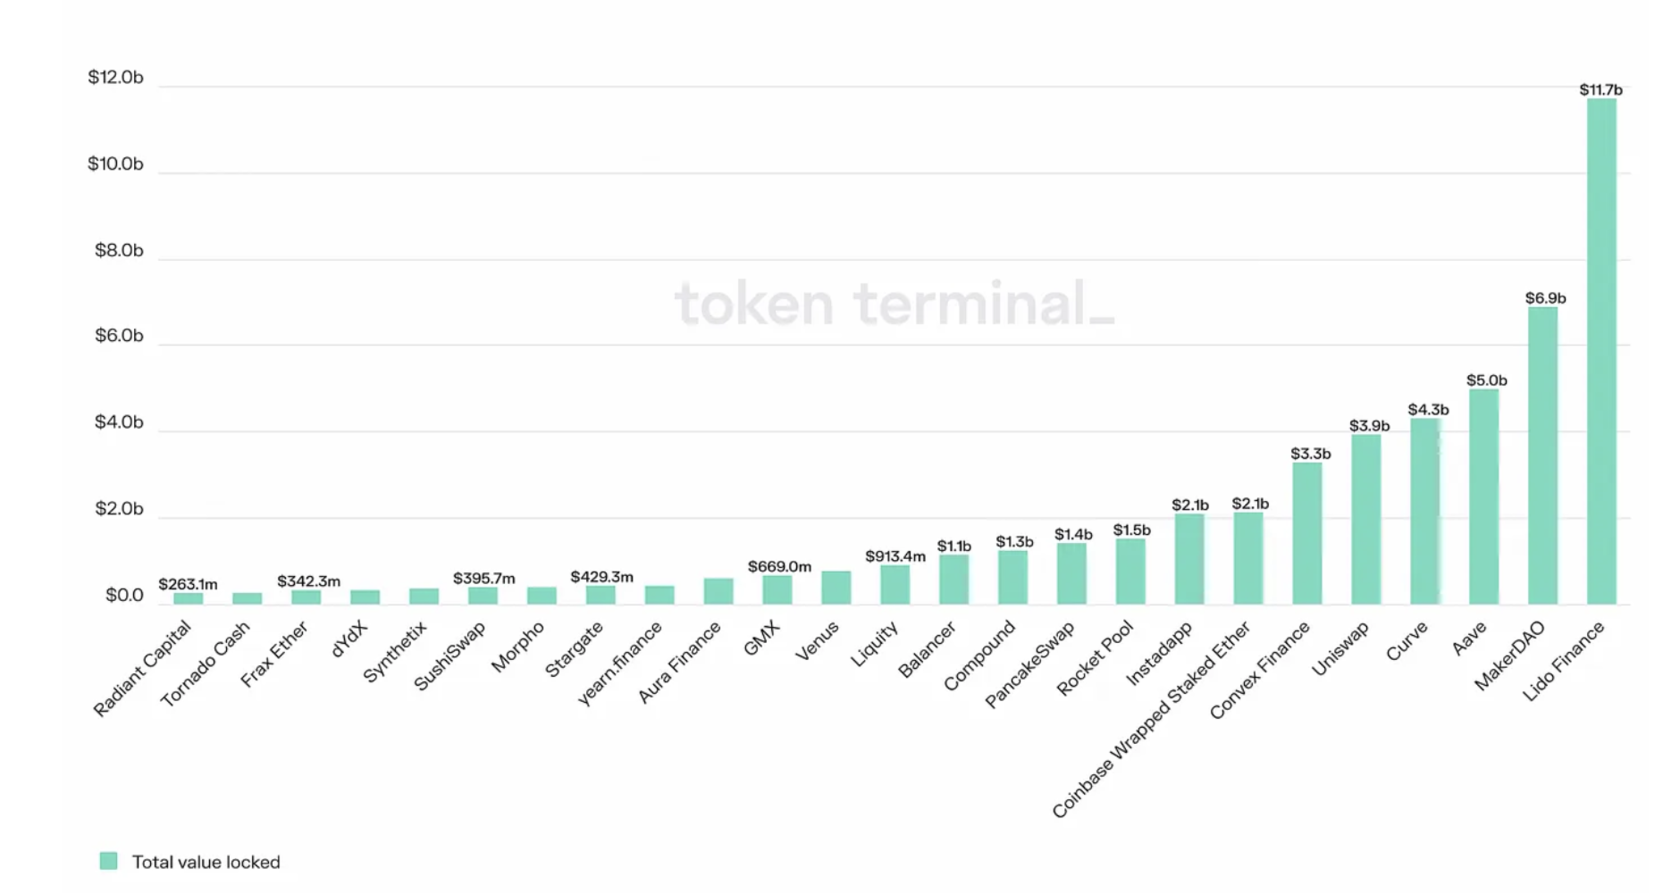
- The total value locked (TVL) has Lido Finance, MakerDao, and Aave as the largest in terms of value locked into their protocol’s smart contracts.
Blockchain Metrics
In the previous month, we observed a surge in the number of sending addresses which reached 15 million. This number is more than twice the amount recorded two years ago during the period of elevated prices. With the emergence of various new applications such as DeFi and web3 games, over 700 of which were launched last year, users can now interact with these applications and generate unique addresses without the need to download or connect a wallet.
Daily Active Users (DAU): number of distinct addresses interacting with business relevant contracts. The most active Blockchains by users are: Tron (1.9M DAU — 12% growth from March) Binance Smart Chain (1.5M DAU — 15% growth from March), Litecoin (561.2k DAU — 35% growth from March), Ethereum (410.6k DAU — 30% decrease from March).
The increasing availability of advanced tools and scaling technologies is drawing more transactions at reduced gas fees. It’s worth noting that the total count of blockchain transactions has surged by more than 50% in the last two years.

Currently, there are almost 30,000 developers actively participating in the crypto industry each month, and the steady increase of 60% since the beginning of the bullish market in 2020 suggests that developers who may have been drawn by the rising prices are remaining engaged.

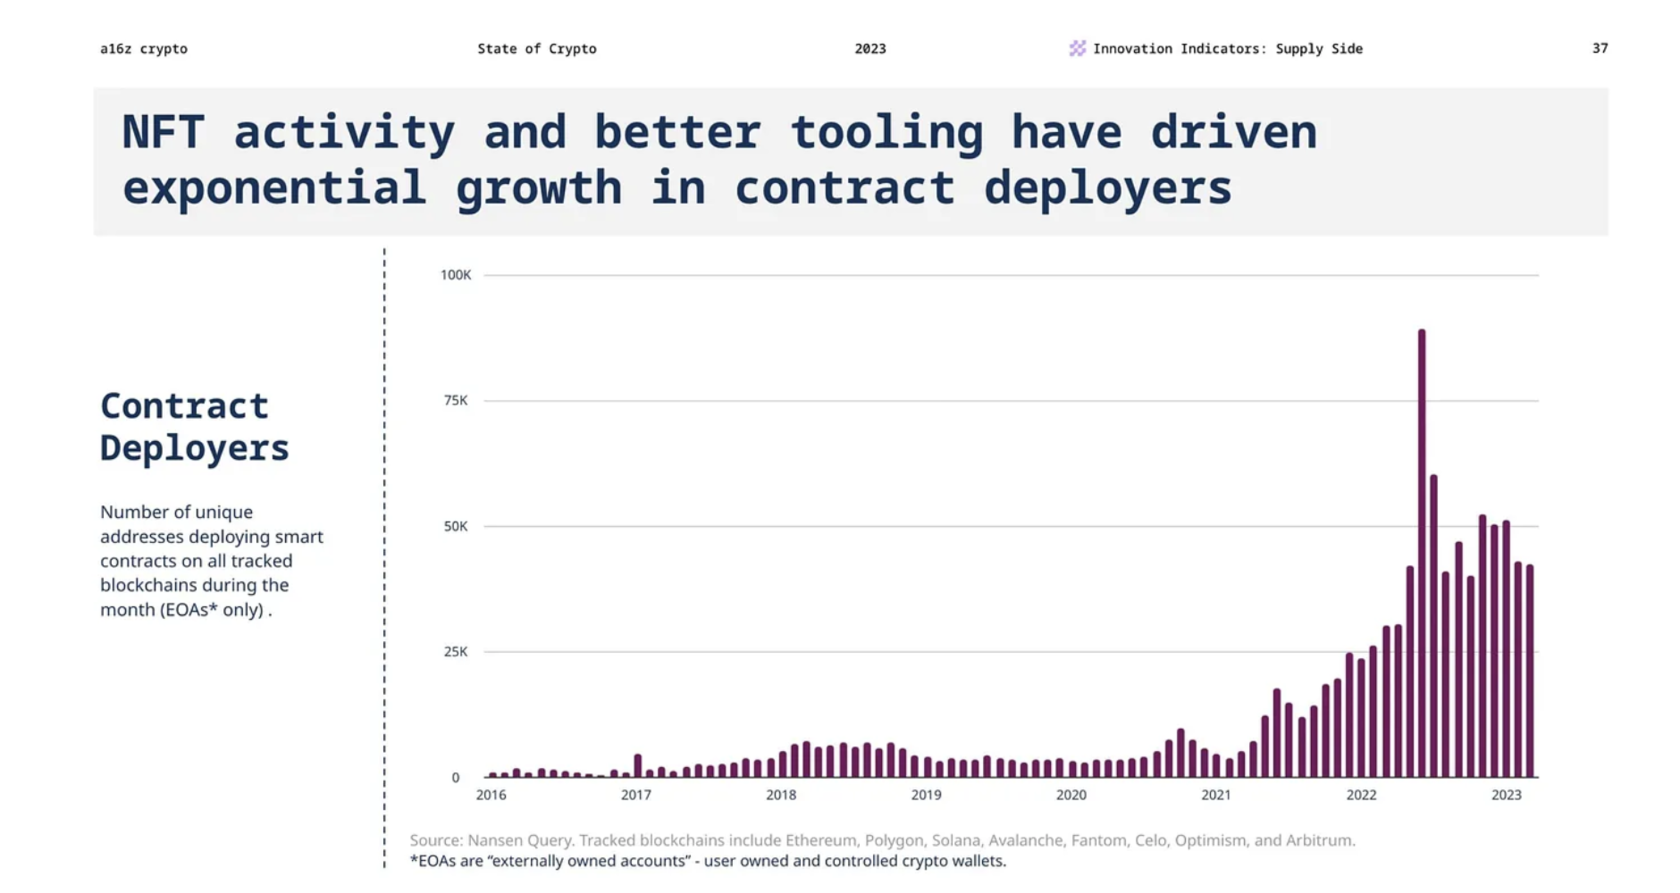
Last month, smart contracts were deployed from almost 50,000 unique addresses, representing a 40% increase from earlier this year. Furthermore, a higher number of these contracts were verified and utilized by core developer libraries, marking an unprecedented trend.
Core Developers (CD): Number of distinct GitHub users that made 1+ commits to the project’s public GitHub repositories during the past 30 days. The most active Blockchains by developers are Ethereum (194 AD — 25% growth), Cosmos (167 AD — 33% growth), Kusama (150 AD — 12% decline), Polkadot (150 AD — 12% decline) and Cardano (143 AD — 2% growth).
NFT metrics
The total trading volume on the NFT platforms has decreased 3 times, from $90MM on the 1 of March to $30MM as of 12th of May.
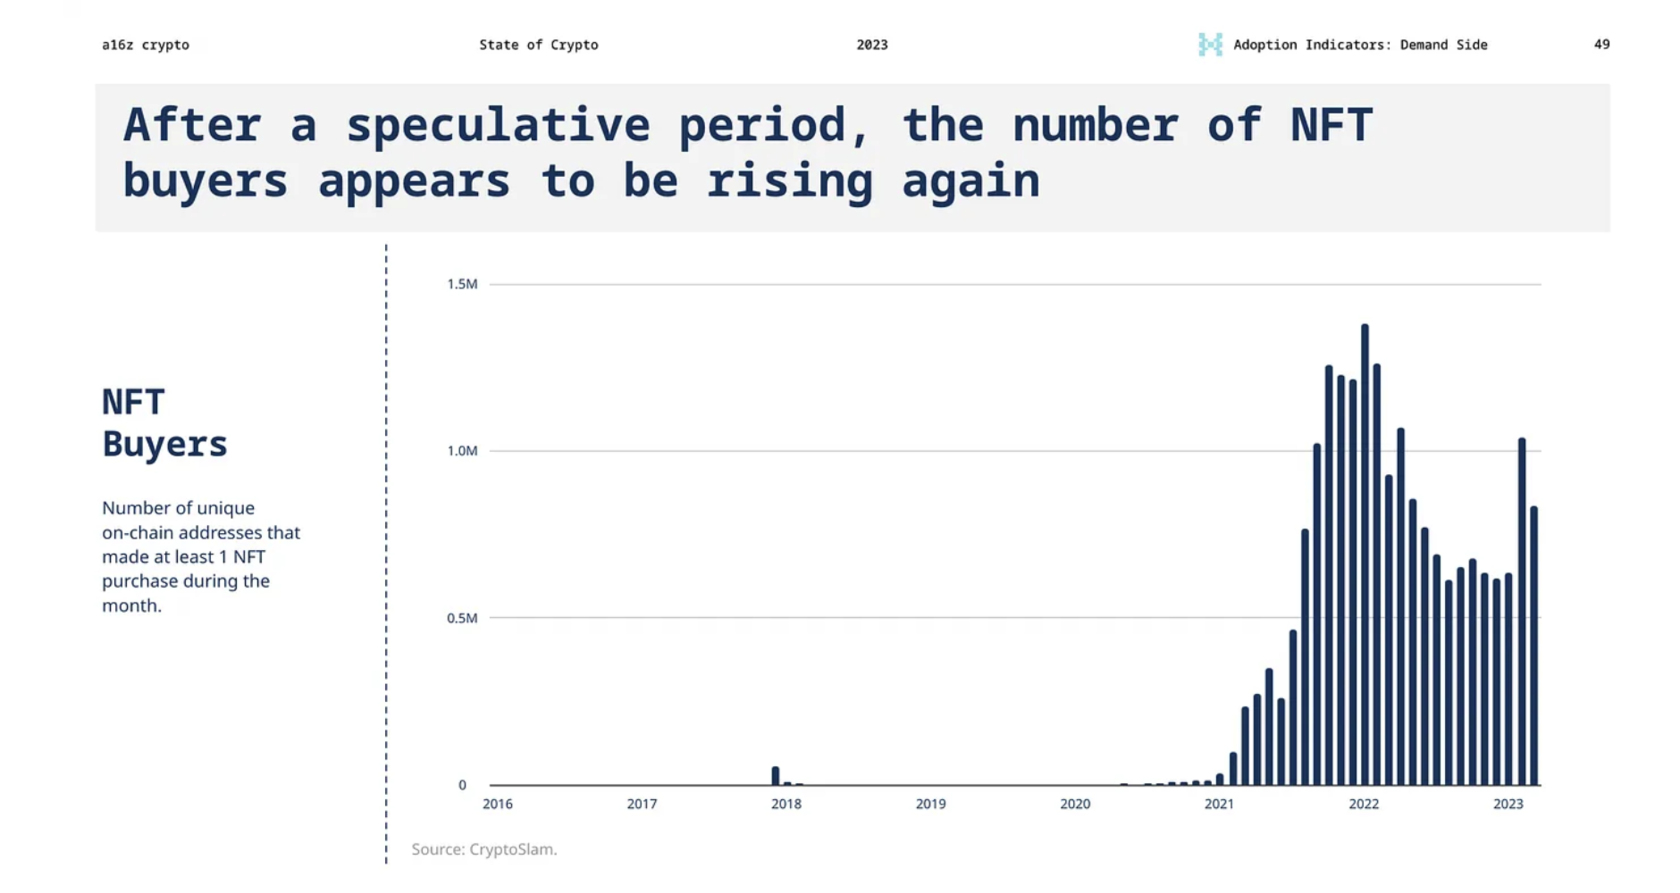
Following the hype of 2021, activity in the DeFi and NFT spaces appeared to have declined. However, it now appears to be on the upswing once again, with more organic uses emerging such as lending, remittances, art, collectibles, on-chain gaming, and more.
Over the past couple of years, NFT platforms have distributed royalties worth almost $2 billion in secondary sales to creators. This figure is striking when compared to web2, where Meta has set aside $1 billion for creators until 2022, despite having around 3.74 billion monthly users on its platforms such as Facebook, Instagram, and WhatsApp, which is significantly higher than the estimated number of web3 users, which is in the tens of millions.
DeFi metrics
Over the past few months, there has been an increase in the number of NFT buyers and volume of DEX. Uniswap, a decentralized exchange, has recorded greater trading volume than Coinbase, the largest centralized exchange in the U.S, for the last two months in a row.
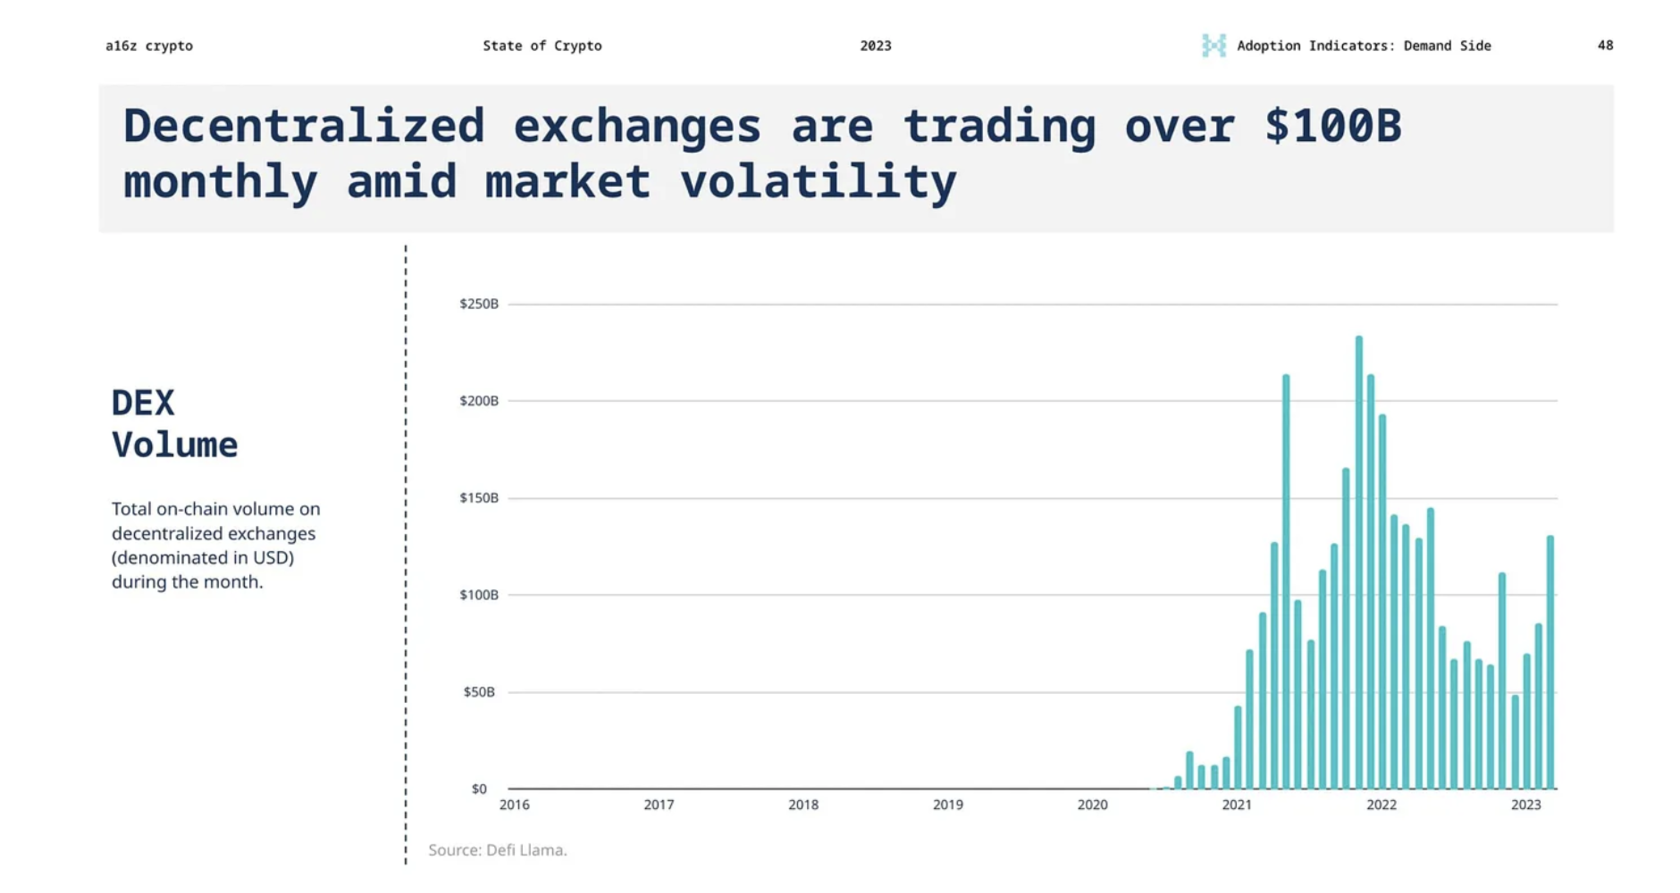
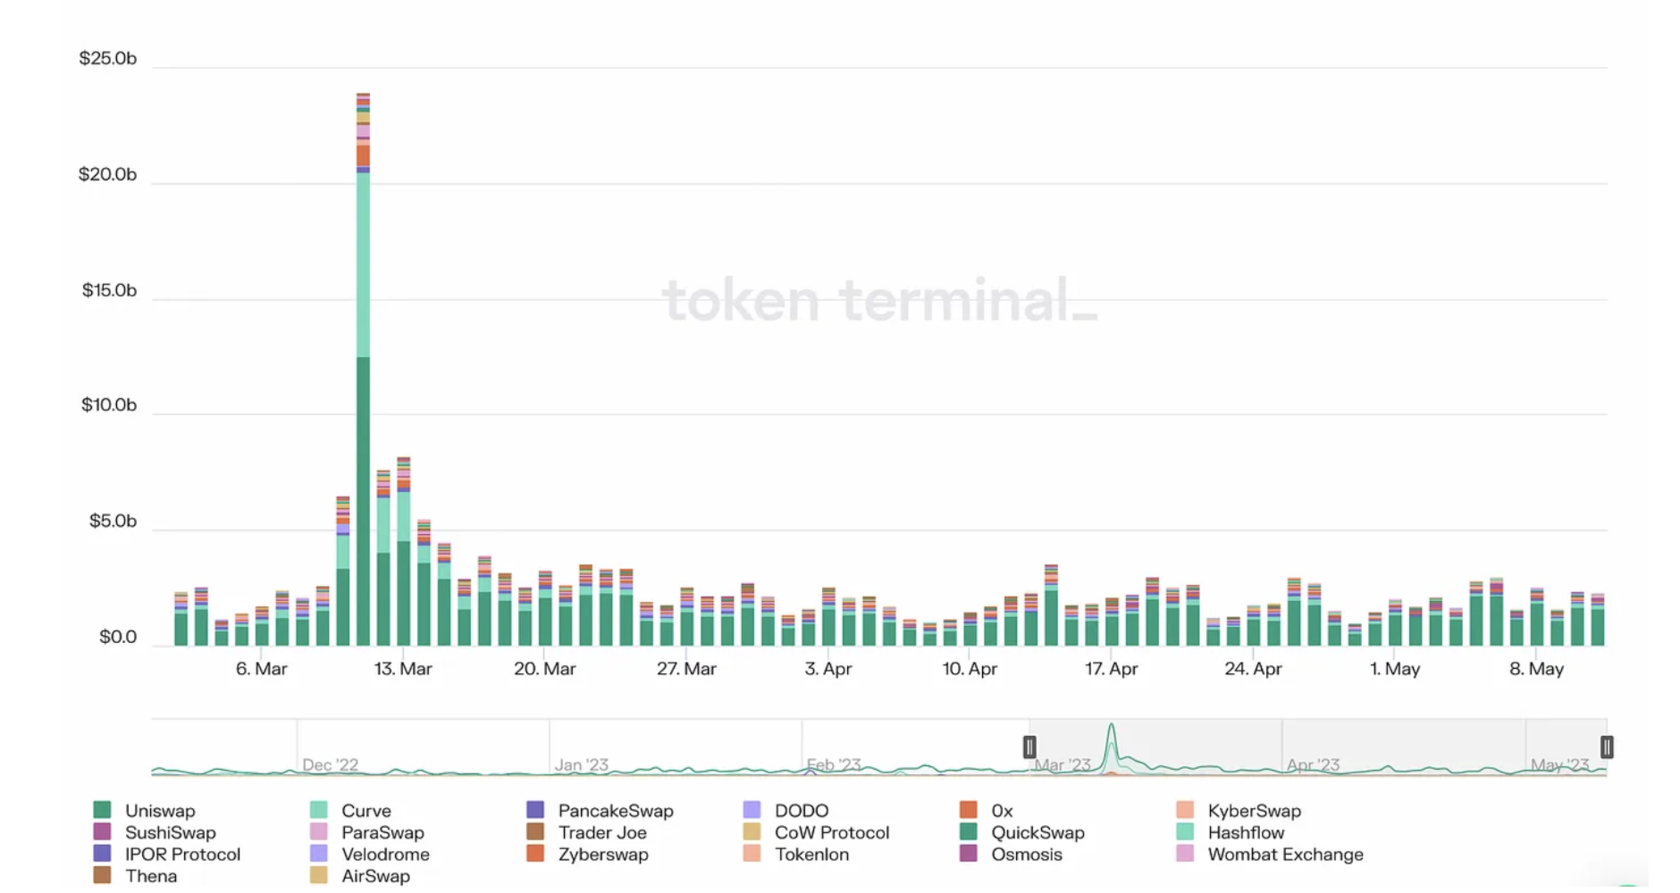
Following the growth in volumes on DEXs from the 10th to 15th of March to almost $24b per day, activity in the DeFi exchanges appeared to have stabilized to $2b per day.
Total value locked (TVL): average value of funds locked into the protocol’s smart contracts. The largest TVL has Lido Finance ($11.7b ), MakerDao ($6.7b ) and Aave ($5b ).
Sources: Token Terminal, CoinGecko, Coinmarketcap, bnbchain.org, ethereum.org, cointelegraph.com, a16z crypto